SVG plot development notes
This file presents a very rudimentary design for a svg-plot.el. Unfortunately, I have no time to finish this now (probably I will continue at some later point), but I guess this could be very useful to someone who would like to work it out a little more.
Creating a simple plot package using svg.el, in theory, should be quite straightforward (although getting automatic scaling to work right, is probably more difficult than it looks). However, SVG defines y-coordinates in a downward direction instead of the upward direction customarily used in plots. Therefore we have to apply some little coordinate transformation tricks to conveniently define our plotting elements.
Furthermore, it is convenient to use a modular design for the plotting image. A convenient way to modular build up an svg image is by using group elements.
(defun svg-group (&rest args)
  (apply #'dom-node
         'g
         `(,(svg--arguments nil args))))

(defun svg-plot-line (format-data &optional color width &rest args)
  (let ((x-min (plist-get format-data :x-min))
	(y-min (plist-get format-data :y-min))
	(w (plist-get format-data :dx))
	(h (plist-get format-data :dy))
	(scale-x (plist-get format-data :scale-x))
	(scale-y (plist-get format-data :scale-y))

	(g (svg-group :stroke (or color "blue")
		      :stroke-width (or width 2)
		      :fill "none"))
	data)
    (setq data (mapcar
		(lambda (p) (cons (* scale-x (car p))
				  (* scale-y (cdr p))))
		(plist-get format-data :data)))
    (svg-polyline g (mapcar (lambda (p)
			      (cons (- (car p) (* scale-x x-min))
				    (- (cdr p) (* scale-y y-min))))
			    data))
    g))

(let* ((w 100)
       (h 100)
       (svg (svg-create w h
			:stroke "black"
			:transform (format "translate(0,%d) scale(1,-1)" h))))
  (with-temp-buffer
    (svg-print (dom-append-child svg (svg-plot-line '((0 . 100) (100 . 200)))))
(buffer-string)))(defun svg-plot-grid (w h dx dy &rest args)
(let ((g (apply #'svg-group :stroke-color "gray" args))
(s (+ 0 dx)))
(while (< s w)
(svg-line g s 0 s h)
(cl-incf s dx))
(setq s (+ 0 dy))
(while (< s h)
(svg-line g 0 s w s)
(cl-incf s dy))
g))
(defun svg-plot-frame (w h &rest args)
(let ((g (apply #'svg-group args)))
(dolist (y (list 0 h))
(svg-line g 0 y w y))
(dolist (x (list 0 w))
(svg-line g x 0 x h))
g))
(defun svg-plot-ticks (format-data &rest args)
(let ((g (apply #'svg-group :transform "scale(1,-1)" args))
(x-min (plist-get format-data :x-min))
(y-min (plist-get format-data :y-min))
(dx (/ (plist-get format-data :data-width) 4.0))
(dy (/ (plist-get format-data :data-height) 3.0))
(scale-x (plist-get format-data :scale-x))
(scale-y (plist-get format-data :scale-y)))
(dotimes (i 5)
(let ((s (round (+ (* i dx) x-min))))
(svg-text g (number-to-string s) :x (* i dx scale-x) :y 20)))
(dotimes (i 4)
(let ((s (/ (fround (* (+ (* i dy) y-min) 100))
100)))
(svg-text g (format "%+4.2f" s) :x -46 :y (- 20 (* i dy scale-y)))))
g))
(defun svg-plot (data &optional w h)
(setq w (or w 400)
h (or h 300))
;; to plot some range, say 0 to 10, to an image of certain width,
;; say 400, we need to scale the data. Info about the image size,
;; data ranges, the amount of required scaling and finally the data
;; itself, we pass via a single plist `format-data' to the data
;; drawing function (svg-plot-line, and svg-plot-ticks)
(let (format-data
x-data y-data)
(dolist (p data)
(push (car p) x-data)
(push (cdr p) y-data))
(let* ((x-min (seq-min x-data))
(x-max (seq-max x-data))
(y-min (seq-min y-data))
(y-max (seq-max y-data))
(dx (- x-max x-min))
(dy (- y-max y-min))
(scale-x (/ w dx))
(scale-y (/ h dy))
(pad-x 50)
(pad-y 40)
(x (+ w pad-x 30))
(y (+ h pad-y 10))
(svg (svg-create x y
:stroke-color "black"
:transform (format "translate(0,%d) scale(1,-1)" y)))
;; :viewBox (format "0 0 %d %d" (* 2 x) (* 2 y))))
(graph (svg-group :transform (format "translate(%d, %d)" pad-x pad-y)))
(grid (svg-plot-grid w h 100 100 :stroke-dasharray "4" )))
(setq format-data (list :x-min x-min :y-min y-min
:data-width dx :data-height dy
:scale-x scale-x :scale-y scale-y
:data data))
(svg-rectangle svg 0 0 x y :fill "white")
(dom-append-child graph grid)
(dom-append-child graph (svg-plot-frame w h))
(dom-append-child graph (svg-plot-ticks format-data))
(dom-append-child graph (svg-plot-line format-data))
(dom-append-child svg graph)
(with-temp-buffer
(svg-print svg)
(buffer-string)))))
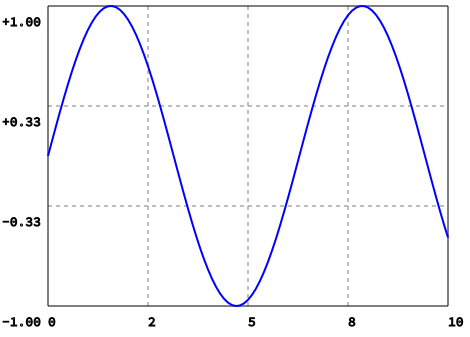
(svg-plot (mapcar (lambda (x) (cons x (sin x))) (number-sequence 0 10 0.1)))The result is shown below (unfortunately, github pages, with remote theme, does not correctly show svg’s so that the below image is a png)